The versatility of system maps is a boon to problem solvers. But it demands careful reflection about the purpose a map is intended to serve and what that means for how it should look. Look before you leap!
System maps - understood as influence or causal-loop diagrams - are powerful conceptual tools.
In fact they are the intellectual equivalent of a Swiss army knife, the archetypal survival tool.
The Victorinox assists us in myriads of ways – cutting, pruning, sawing, puncturing, and more – indispensable when navigating the great outdoors. Similarly, a system map is a flexible platform to help us to come to grips with the complexity of today’s wicked problems.
But this versatility comes at a price. It requires us, as map developers, to clearly think upfront about the purpose the system map is intended to serve.
In fact complexity may lead us to consider a variety of map-supported strategies. These strategies may translate in different requirements for the systems map and those requirements may or may not be aligned. Conflicting requirements obviously deepen the design challenge.
For instance, one of the key contributions often expected of a system map is that it clearly communicates the causal architecture behind a problematic situation. That puts a limit on the number of variables and linkages in the map. Because people are very often - and rightly so - put off by un-decodable 'spaghetti diagrams'.

Diagram portraying the complexity of America's military strategy in Afghanistan via NYTimes.com.
There is a well-known rule that says that the number of information elements an average human can hold in working memory is 7 ± 2!
However, a lot of mapping efforts happen to be evidence-driven. Interdisciplinary research on large-scale and multidimensional societal challenges typically results in an extensive database of relevant map elements. This also reflects the challenge’s wicked character and drives us towards very complicated maps that are hard to read. In my experience it is not unusual to end up with 150 and more variables in a map.
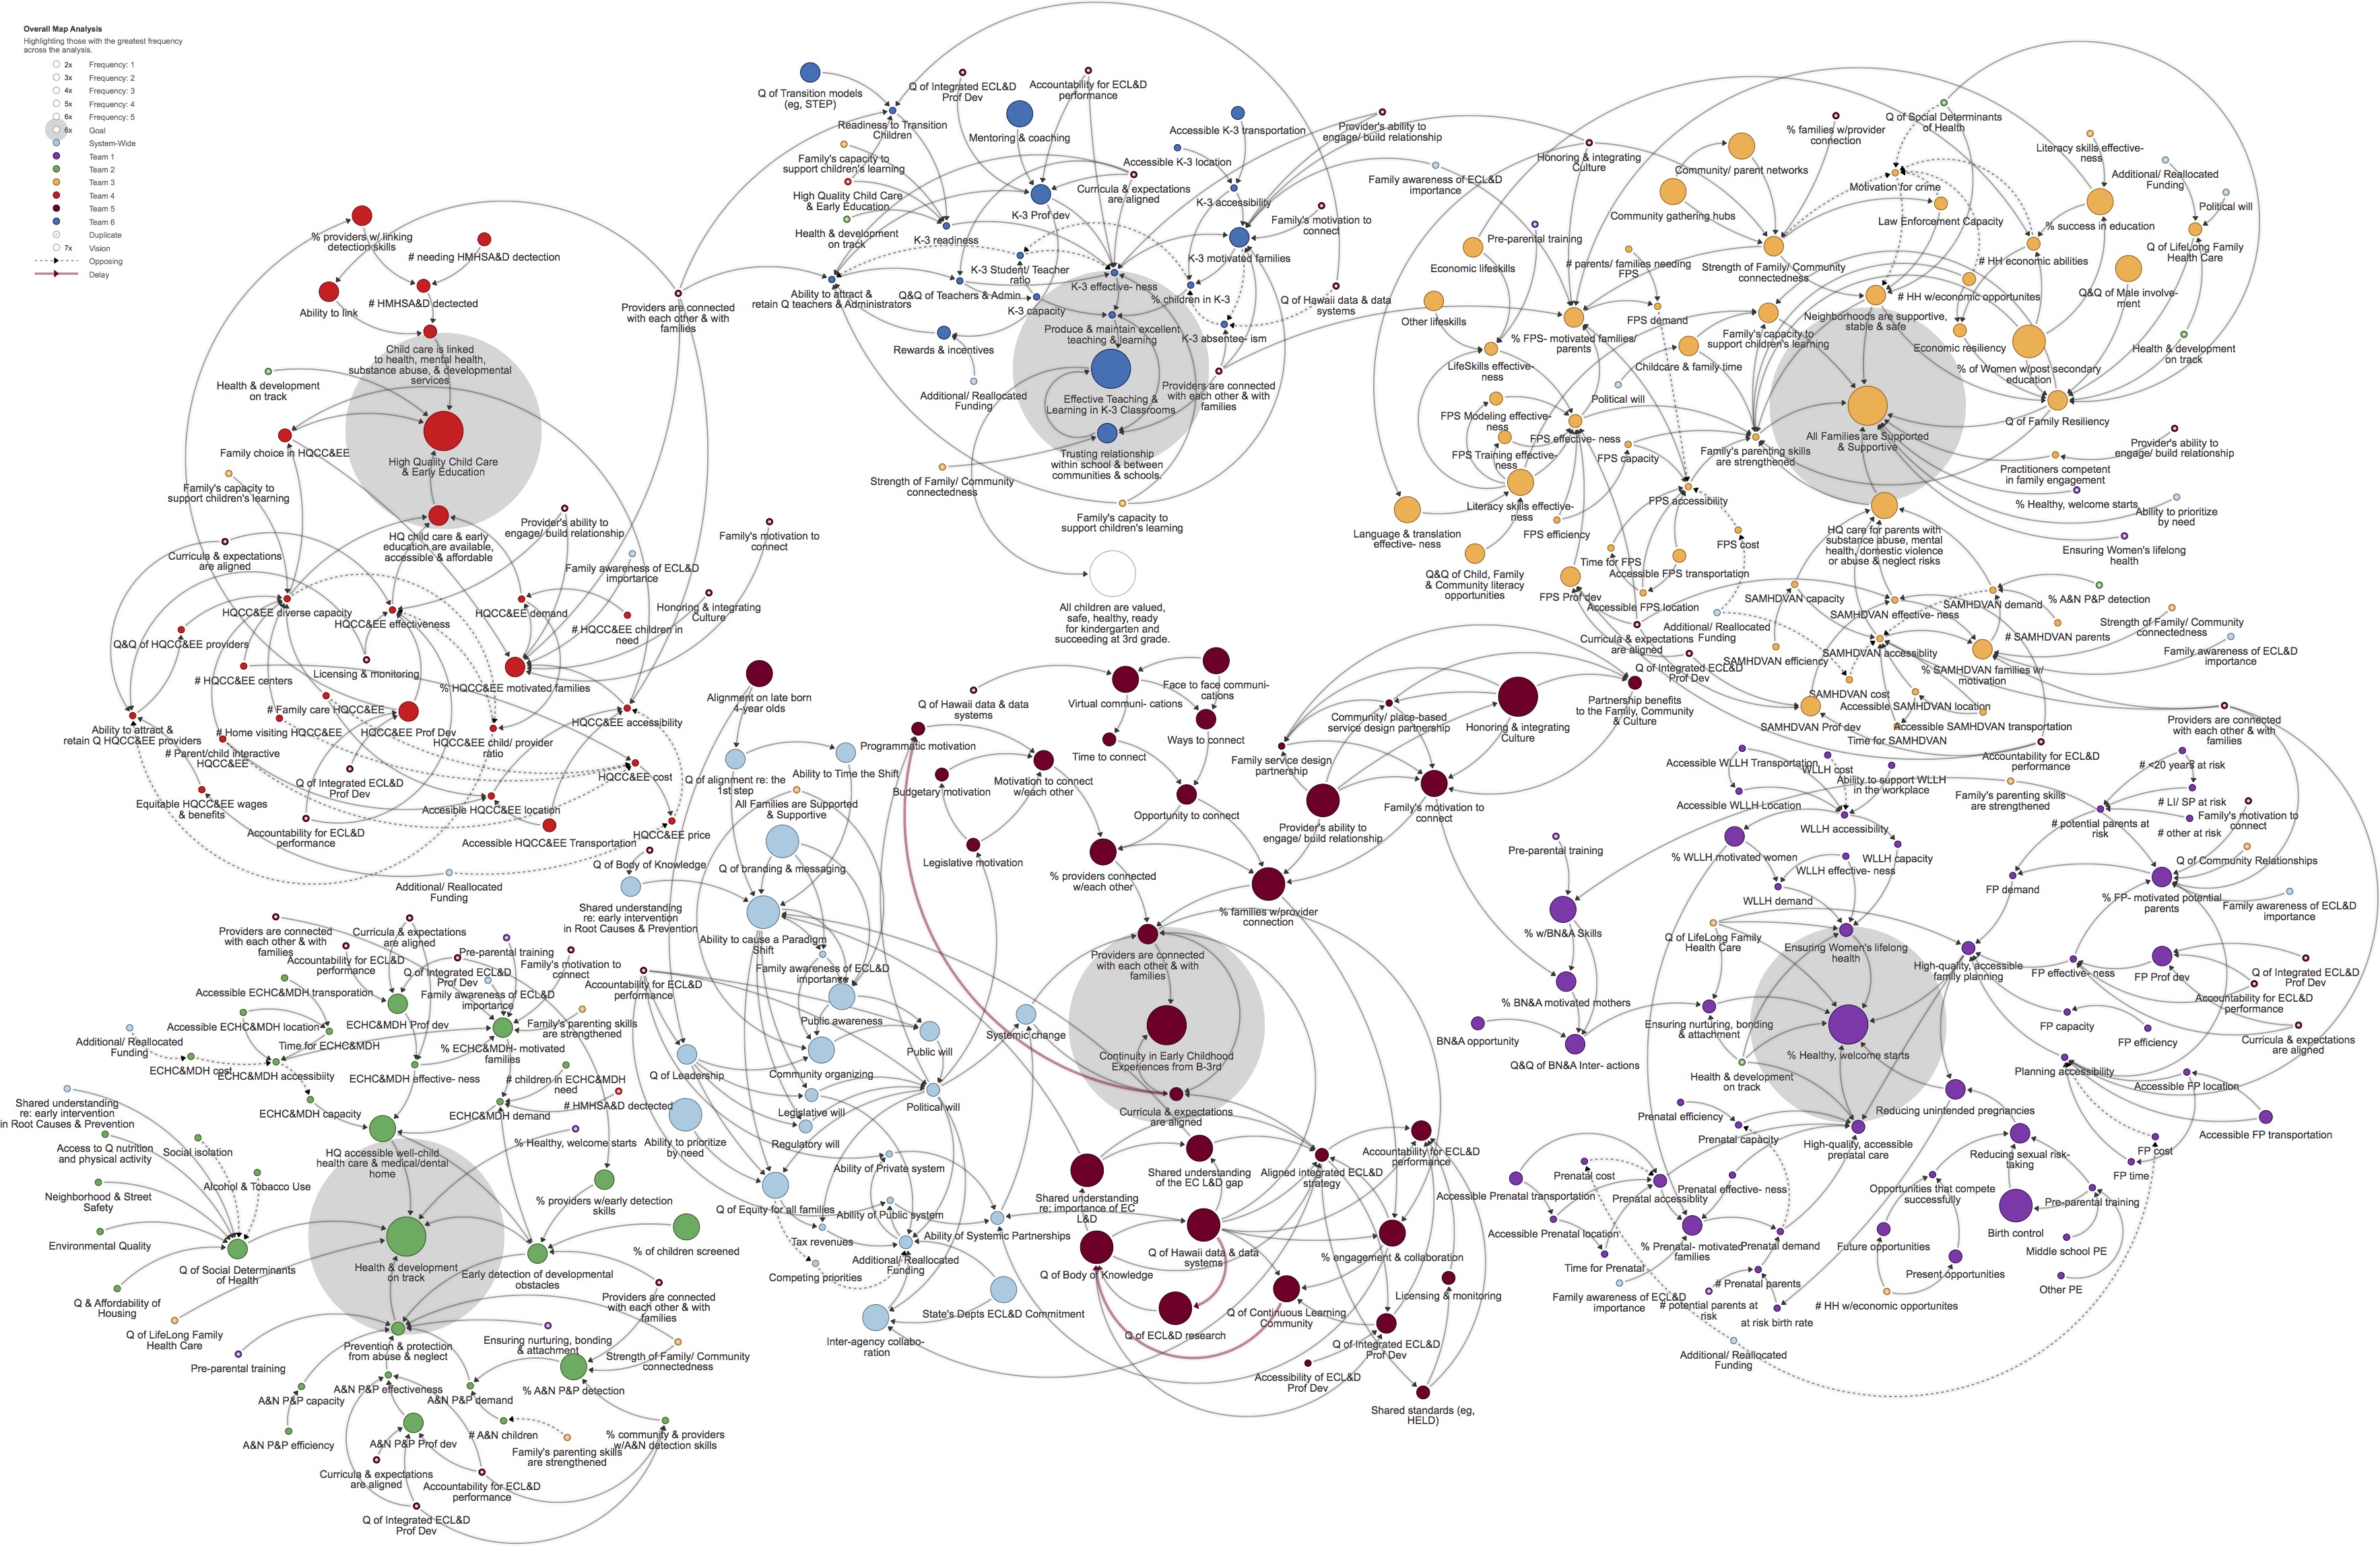
Mapping the system of early childhood development (via Hawaii's Early Childhood Action Strategy).
When system maps must be faithful to evidence AND be easy to read, we need to find approaches that align these two requirements. Kumu provides us with tools to do so - such as decorations, perspectives and presentations. Careful thinking and tinkering is needed to find a workable approach.
It can get more delicate still when we consider a few other requirements. In evidence-driven projects the system map can function as an information management tool. It structures and provides access to the underlying data, for instance via hyperlinks to online reports or wiki pages. The map must therefore be a suitably strong indexing engine. This means that the variables and linkages are conceptualized in such a way that they easily and truthfully connect to the data. This kind of scholarly scrupulousness is often associated with the use of specialized language. And the presence of this kind of jargon may clash with our desire to provide a smooth user experience for a less expert audience.
Just as an example, suppose we are developing a map on the challenge of obesity. One of the key variables in the map might be ‘psychological ambivalence’, or more fully expressed as ‘the level to which people are subjected to psychological ambivalence’. Ambivalence is a technical construct that refers to a state of having simultaneous, conflicting feelings toward, in the present case, food. It will be easily linked to relevant scientific literature but it likely means very little to people with a non-specialist background. A large number of these ‘technical’ variables will render the map opaque to a wide audience.
In other contexts a causal-loop diagram may function as a precursor to a quantitative model. However, for a successful translation from a qualitative map to a predictive model map developers need to take this requirement on board at a very early stage of the design process. The number and nature of the variables and their interconnections will have to be carefully tweaked to provide a solid bridge to the construction of a more formal simulation model. This requirement can (but doesn’t necessarily have to) be at odds with available real-world evidence and the map’s communication power.
The basic message is that it is good to pause at an early stage of the development of a systems map and think carefully about the various purposes it is required to serve, the associated requirements and the extent to which they conflict or align. That assessment will help tremendously in smoothing out the development trajectory and will enhance the perceived quality of the end product by its users.