Earlier today Jeff released his Celebrity Ice Bucket Challenge map, showing who challenged who and making it easy to watch the top videos. It's already up to #2 on our explore page and even made it to the front page of HackerNews!
We wanted to break down the process of building the map and show how anyone can build maps like this on their own.
Let's get started!
Step 1: Decide what to map
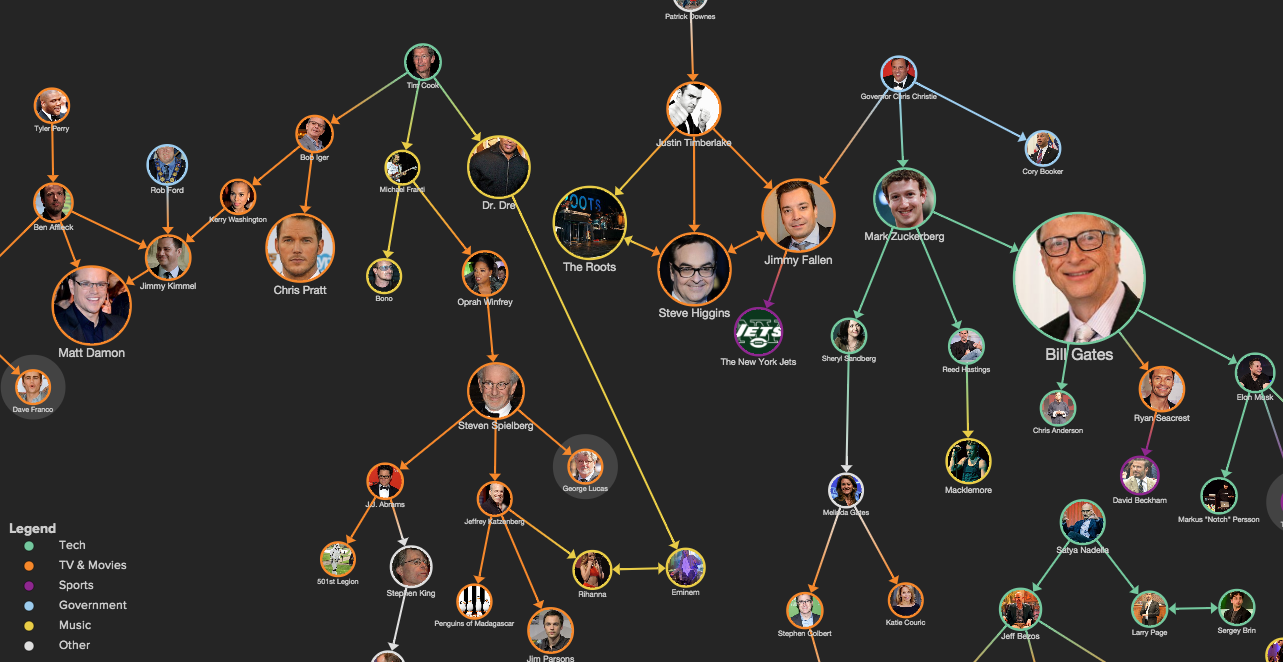
This one was easy, since the ALS challenge built a natural network through the nominations. We wanted to show three things:
- Which celebrities took the challenge
- Who they challenged
- And who failed to accept the challenge
We knew ahead of time the network was far too large to gather in its entirety, so we focused the map on the networks surrounding the celebrities with the most popular videos.
Step 2: Figure out how you're going to get the data
Many of the videos were shared on Facebook but luckily most of the popular videos also made their way to YouTube. We started by watching some of the more popular videos we had heard about (Marc Zuckerberg and Bill Gates) and then listened to who they nominated and just followed the trail.
We didn't find any great compilations of the data so we decided we'd do it the old fashioned way, by watching videos and searching for videos by key celebrities.
Step 3: Think of an intuitive way to size and color the map
Decorations are great but it's easy to get carried away with them. Most times a simple, intuitive combination of size and color gets the job done best.
Size
Since we based the map around the celebrities with the most popular videos, we were naturally drawn to sizing the elements by number of views.
At first, Bill Gates's video threw off the sizing since he has so many more views than everyone else. Rather than having him as the only dominant element, we broke the scale into two parts. Here's the advanced perspective that makes that happen:
element["video views" < 10000000] {
  scale: scale("video views", 1, 3.5);
}

element["video views" >= 10000000] {
  scale: 3.7;
}
We'd love to size celebrities by donation amount as well, but the data wasn't available.
Color
We were curious if the nominations spanned across sectors (musicians nominating tech titans) or stayed within sectors (actors nominating each other) so we chose to color by sector.
The first step is to decide on a set of categories that groups the elements into 3 - 7 groups. If you have more groups than that, try grouping by another trait or use an "Other" group for the outliers.
The second step is to pick a good color palette and for that we recommend Kuler or ColorBrewer. Or you can borrow one! Lucky for us, Fast Company already had a static map of the nominations which served as inspiration for some of our color choices.
By coloring each person by sector we were able to see that most celebrities stuck to their own sector. Of course there are always the exceptions, like Tim Cook, Jeff Bezos, and Elon Musk.
Step 4: Build the map
We love to automate this process through imports, but in this case we ended up watching videos, listening to the nominations and making the connections directly through Kumu's interface.
We started with a floating layout so the network structure could emerge naturally. However the floating layout is designed for social networks and this was more of a hierarchy, so we ended up pinning the elements in place and arranged the flow from top to bottom.
Step 5: Add some media and a bit of storytelling
The network of celebrities is interesting in itself but some of the videos are truly great (check out Jeff Bezos, Bill Gates, or Chris Pratt for a few of our favorites). We wanted to make it easy for people to watch all of these in one place.
Luckily, it's easy to embed videos directly into the description for any element. Simply grab the ID of the video (available as the string of numbers at the end of the YouTube url: https://www.youtube.com/watch?v=XS6ysDFTbLU).
Just drop that ID into this format [[youtube/ID]] and you're ready to go. Here's what it looks like: [[youtube/XS6ysDFTbLU]].
It's also easy to include links to other elements so that you can tell the story of the nominations in the description and easily hop to other challenges. We used the new selector link widget to build these out. All you need to do is include [[Label]] where "Label" is the full label of the element. Here's an example:
Mark Zuckerberg accepts the challenge from [[Governor Chris Christie]] and challenges [[Sheryl Sandberg]], [[Reed Hastings]], and [[Bill Gates]].
Step 6: Share it!
Once the map was ready to go, we converted it from private to public and got the word out (check out the links at HN, Twitter and Facebook).
We also created an embed link for anyone who's wants to include the map on their website. Here it is:
<iframe src="https://kumu.io/embed/c0ea769b971a74ad2c2d4f31428d482e"
  width="100%" height="600" frameborder="0"></iframe>